Do tiny particles follow the swirl?
A hands-on version of the study. Move the sliders and watch. Everything here is slowed down about 20 times so your eyes can follow it.
Spin the inner cylinder
Liquid fills the thin gap between two cylinders. The inner one spins, the outer one stays still. You are looking at the outside of the cylinder. Turn up the speed and watch the pattern change.
Try this: Slide the speed up and watch the flat bands start to wave.
The blue stripes show the rolls of liquid, stacked on top of each other like doughnuts. The paper studies the wavy stage, where these rolls wiggle up and down about 8 times every second.
Smooth flowSame wobbling swirl, two kinds of particles
Now zoom into one spot in the wavy flow. The wobbling swirl keeps tilting the "preferred direction" back and forth (the faint band). Each line below is one particle. Watch which ones tilt along with it.
Try this: Watch the small graphs. For the flakes, the solid line follows the dashed one. For the rods, it doesn't.
Graphene oxide flakes ~2 µm wide, big ✓ Follows the swirl
Each teal line is one flake. Together they rock about 8 times a second, in step with the swirl.
Cellulose rods ~0.23 µm long, small ✗ Ignores the swirl
Each orange line is one rod. Random bumps make them jiggle about 29 times a second, ignoring the swirl.
What are the small squares?
They show what the X-rays see. Scientists can't photograph each particle, so they shine X-rays through the whole crowd. When the particles line up, the round spot stretches into a streak. The team recorded this 100 times a second at the MAX IV synchrotron. (Particle sizes here are not to scale.)
Try the tug-of-war yourself
Two things turn a particle. The flow tries to line it up. Random bumps from water molecules (Brownian motion) spin it in random directions.
Try this: Slide all the way left, then all the way right. Watch the X-ray spot change from round to a long streak.
Your particles
Particles in a tug-of-war you control with the slider.
Small particles get spun much faster: half the size means about 8 times more spinning. Physicists compare the two with one number, the rotational Péclet number:Péclet number=flow strengthrandom spinning
Watch real experiments
The animations above are simplified models. These show real liquids in spinning cylinders. Fun fact: those shiny bands in the videos come from tiny reflective flakes mixed into the water, used exactly because flakes line up with the flow.
Try this: In the first video, look for the moment the flat bands start to wave, just like in Step 1.
 Instability of Taylor–Couette flowBands appear and start to wobble as the inner cylinder speeds up.Watch on YouTube ↗
 Taylor rolls at OISTRows of rolling vortices, from calm to turbulent, in a research lab setup.Watch on OIST ↗
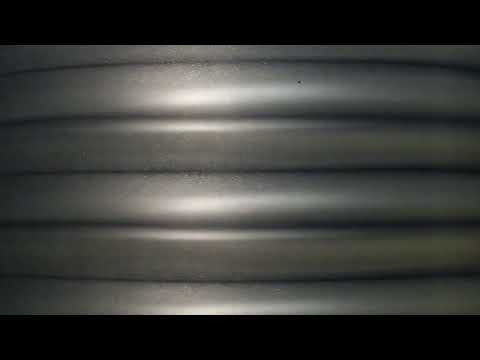 Student Taylor–Couette visualizationA homemade version with photos and video, from a Flow Visualization course.Watch on FlowVis ↗
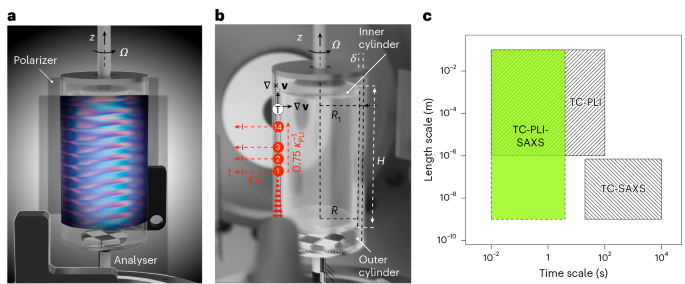 The paper itself (Nature Physics)Look at its figures of the X-ray patterns and the 8 vs 29 per second rhythms.Read in Nature Physics ↗
Source. Sekar, K., Ghai, V., Ghanbari, R. et al. Multiscale transitional flow in anisotropic nanoparticle suspensions revealed by time-resolved X-ray scatter microscopy. Nat. Phys. (2026). https://doi.org/10.1038/s41567-026-03467-1. The simulations on this page are simplified illustrations made for EPhylab by Ermuun Battulga, not the authors' data.
Want the next simulation?
Every new one comes with its own article. Subscribe for free and get notified as soon as they're ready.